by Guest Author | May 8, 2025 | Data, News, Policy, Reports
The Bowen Center for Health Workforce Research and Policy at Indiana University is pleased to share its interim report to the Indiana Department of Health covering activities from July 2024 through January 2025.
This report provides an overview of the Center’s efforts to support data-driven health workforce planning and policy across Indiana and highlights ongoing initiatives which focus on health workforce data collection, analysis, and stakeholder collaboration. The report also reflects the Center’s continued commitment to producing actionable insights and engaging key partners to inform health workforce development and decision-making.
Through its work, the Bowen Center aims to ensure that Indiana’s health workforce is aligned with the needs of communities statewide. This interim report is intended to provide transparency on progress to date. We invite you to review the full report below to learn more.
by Guest Author | Apr 23, 2025 | Data, Policy, Presentations
The physician workforce is critical in ensuring access to health care across Indiana. In a presentation to the Indiana Society of Physician Recruiters, Bowen Center Director Dr. Hannah Maxey will present an overview of the state’s physician workforce’s current status and future outlook.
The presentation will include an overview of the latest Indiana physician workforce data including a description of total supply, geographic distribution and primary practice setting. In addition to this supply data, Dr. Maxey will present demand data from Indiana Department of Workforce Development and educational data from the recent Indiana Physician Pipeline to Practice report. Additional topics will include physician wellness and burnout, artificial intelligence, and highlights from the 2025 Legislative Session.
Check out the full slide deck below!
by Guest Author | Mar 27, 2025 | Data
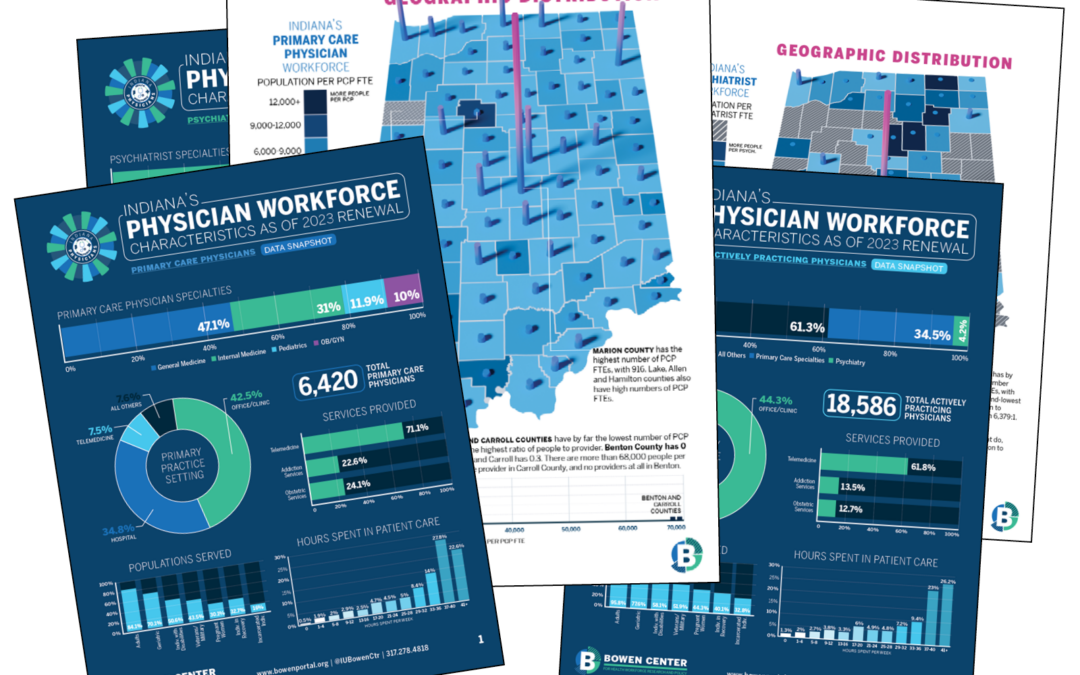
The Bowen Center for Health Workforce Research and Policy has released its latest data snapshots detailing Indiana’s physician workforce characteristics as of the 2023 license renewal process.
The three new reports cover:
- All Actively Practicing Physicians – With 18,586 physicians statewide, the data reveals that 61.3% of physicians reported practicing in specialties outside primary care, while 34.5% reported a focus on primary care and 4.2% on psychiatry. 61.8% of physicians reported providing telemedicine services.
- Primary Care Physicians – Indiana has 6,420 primary care physicians, with Family/General Medicine (47.1%) and Internal Medicine (31%) representing the largest specialties, as self-reported by Indiana primary care physicians. Over 71% reported providing telemedicine services, and nearly 23% reported offering addiction services.
- Psychiatrists – The state has 782 actively practicing psychiatrists, with 90.5% reporting a specialty of general psychiatry and 9.5% in child psychiatry. Notably, 31 counties report no psychiatrist FTEs, highlighting significant disparities in mental healthcare access across Indiana.
Each snapshot includes a detailed map of geographic distribution, showing both the number of each type of physician in each county, the per capita figures, and a histogram showing country distribution. Marion, Lake, Allen, and Hamilton counties showing the highest concentration of physicians, while rural counties like Benton and Carroll face major shortages.
Does Indiana physician health workforce data pique your interest? Take a deep dive into Indiana’s 2023 Physician Workforce Data Report, complete with interactive data and charts galore at this link.
Check out each of the snapshots directly below or download the documents using the links in the text above.
All Indiana Physicians Workforce Snapshot
Primary Care Physician Workforce Snapshot
Psychiatrist Workforce Snapshot:
by Guest Author | Feb 18, 2025 | Data, Policy
Retention of medical students and residents is crucial to ensuring a strong physician workforce. This report examines retention within Indiana’s medical education pipeline between 2019 and 2024, challenges faced by residency program directors, trends in physician workforce capacity at Indiana hospitals, and existing initiatives supporting medical education and training in Indiana.
This work was completed in collaboration with the Indiana Department of Health. It is our hope that this report can inform discussions and policies targeting medical education in Indiana.
Read and download the project summary report below or find the full report here.
by Guest Author | Feb 4, 2025 | Data, Presentations
The Bowen Center’s Assistant Director for Data and Research Sierra Vaughn recently spoke in a panel of experts on the intersection of addiction and policy. This was part of a webinar titled Reflections and Insight on Response to a Public Health Crisis: The Addictions Grand Challenge.
In her section of the panel she briefly outlined the various aspects of Bowen’s data-related work that intersects with addiction, addiction counseling, and behavioral health, providing a quick overview of the data landscape in Indiana on this critically important topic. The entire presentation is worth a watch, featuring contributions from several experts in the field.
Click here to watch the webinar on an external site (this link is timestamped to Sierra’s contribution).
Or you can watch the entire webinar below. (Sierra’s section begins at around the 26:33 minute mark).
by Guest Author | Jan 28, 2025 | Data, Policy
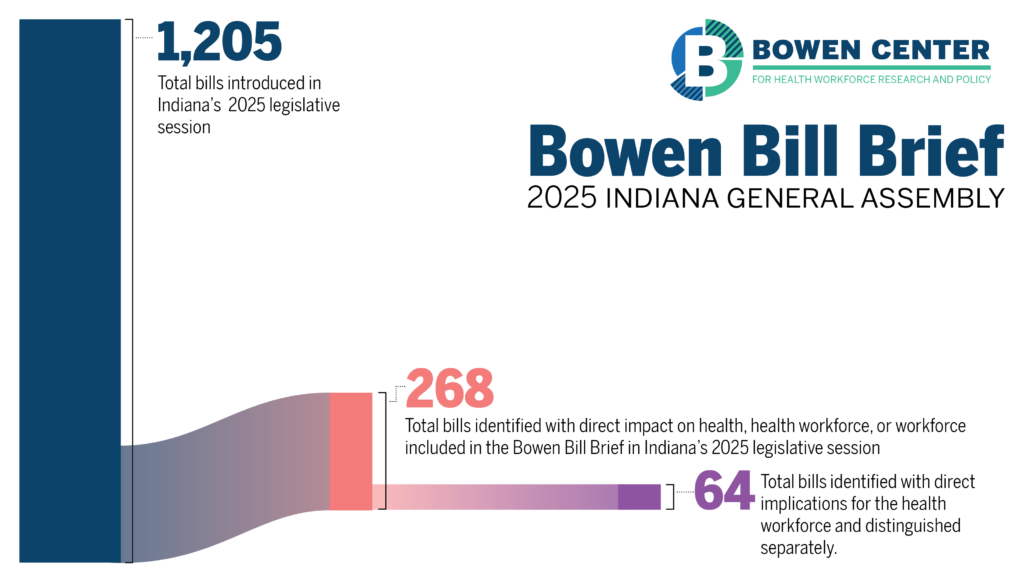
The 2025 legislative session is in full swing, and the landscape just got easier to navigate. Almost 300 bills related to health, the health workforce, or the workforce generally were introduced this session. The Bowen Center will be tracking these bills as the session continues. While you’ll still find our comprehensive bill tracking table with all the details on each bill being considered, we’re excited to introduce a new dynamic dashboard that puts the session’s pulse at your fingertips. Our interactive infographic gives you real-time insights into the status of health care workforce legislation, from start to finish, across both chambers. Whether you’re tracking workforce initiatives, regulatory changes, or public health measures, you can now visualize the flow of bills through the legislative process and quickly identify trends in health care policy priorities. We have summarized a few pieces of legislation below that intersect with work previously done by the Bowen Center. Check out the dedicated Bowen Bill Brief page for full details on all the bills we’re tracking.
Nursing Workforce
- There are several bills this session focused on the advanced practice registered nurse (APRN) workforce. SB 447 aims to establish a license specifically for APRNs in Indiana. APRNs are licensed registered nurses (RN) with additional training that provides the clinical knowledge and experience to deliver advanced nursing care. Currently, all Indiana APRNs are required to hold an Indiana RN license, and many, but not all, also hold an APRN prescriptive authority license. In 2023, the Bowen Center completed a national review of state approaches to APRN licensing to see how Indiana’s approach compared to other states. Only one other state (Wisconsin) has an approach similar to Indiana’s, and this is still the case in 2025. Check out the full report here.)
Physician Workforce
- Indiana is facing a physician workforce shortage due to multiple factors, including burnout, an aging population, and competition from other states. Both HB1068 and HB1400 focus on workforce incentives targeted toward retaining physician talent in Indiana. HB1068 seeks to establish a program for medical school loan forgiveness while HB1400 seeks to provide a tax credit for preceptors in medical education. Many states have used tax credits to retain and recruit the clinical preceptors required for health professions’ education. In 2024, the Bowen Center reviewed tax credits as an incentive strategy for clinical preceptors using data from other state program evaluations. More information can be found here, including considerations for Indiana.
- Recruitment of physicians plays a role in alleviating physician workforce shortages. HB 1555 focuses on the recruitment of foreign trained physicians to Indiana. HB1555 seeks to establish a limited medical license for those who have graduated from international medical programs, obtained a sponsor, and agreed to work in a medically underserved area. In 2021, 22% of actively practicing physicians licensed in Indiana reported completing their education in another country. This suggests that HB1555 may have significant impacts on workforce supply. Check out the education tab on the Bowen Center’s Indiana Physician Workforce Dashboard to get information on Indiana Physicians who completed medical school in another country.
Behavioral Health
- All of Indiana’s 92 counties contain a federally designated mental health workforce shortage. As a part of the Playbook Project, the Bowen Center convened stakeholders to discuss challenges and opportunities for strengthening the pathway to practice for the mental and behavioral health professionals in Indiana. Opportunities to streamlining licensing while maintaining safety and quality were identified as a top priority by many stakeholders. HB1520 and SB216 include proposed changes to licensing policies for selected professions.
- Workforce incentives were another priority identified by stakeholders during the Playbook Project. Incentives are needed to recruit and retain qualified behavioral health and human services professionals into the workforce. HB1154 aims to establish a behavioral health preceptor tax credit. This bill, in hopes of aiding retention, would provide a $1,000 state tax credit for a behavioral health professional who precepts a qualified student. HB 1261HB 1261 seeks to establish a behavior analyst license, which would add a profession to the licensed behavioral health and human services workforce in Indiana.
Direct Care Workforce
- Indiana’s population is steadily getting older, with an estimated 1 in 5 Hoosiers over the age of 65. An aging population typically indicates a greater demand for health care professionals, specifically direct care workers, such as home health aides (HHAs) and certified nursing aides (CNAs). HB1161 would establish a license, training, and competency requirements for home health aides. SB 449 would require home health agencies to run a criminal background check on employees on an annual basis.
- Currently, statute does not allow an individual with a felony offense related to substances to work as a CNA within five years of the offense. HB1385 alters this requirement to allow an exception if the CNA becomes certified as a peer recovery coach. The Bowen Center is excited to launch workforce dashboards for CNAs, HHAs, and qualified medication aides later in 2025! In the meantime, you can review a summary of research we completed in 2024 on direct care workforce data here.