
by Guest Author | Mar 19, 2026 | Data, Reports
The latest Indiana pharmacist workforce data report presents an analysis of Indiana’s actively practicing pharmacists, drawing on information reported during the 2024 license renewal period. It examines demographic trends, qualifying education, employment characteristics, practice settings, and county-level full-time equivalent distribution to illustrate the structure and capacity of the statewide workforce.
Complementing the full report, the pharmacist workforce snapshot distills several core findings into accessible visual summaries. The snapshot highlights geographic distribution, populations served, practice settings, and common services provided, offering an at-a-glance look at key workforce patterns.
Read both documents below.
by Guest Author | Feb 26, 2026 | Data, Reports
The Bowen Center for Health Workforce Research and Policy has released its analysis of Indiana’s physician assistant workforce, offering insights into who these professionals are and where they practice.
The report paints a picture of a young, predominately female workforce, with most PAs holding advanced degrees and planning to continue in their current roles. These professionals work across diverse healthcare settings, from emergency departments to specialty clinics, and play a vital role in patient care throughout the state.
However, the data also reveal a challenge: geographic maldistribution. While urban communities tend to benefit from strong PA presence, some rural areas struggle with limited access or no PAs at all. This unevenness could affect healthcare access for Indiana residents.
The findings provide valuable context for understanding the strengths and gaps in the Indiana PA workforce. Read the full report below.
by Guest Author | Feb 26, 2026 | Data, Reports
Indiana’s physician assistant (PA) workforce reflects a young, growing profession with more than 2,400 actively practicing PAs serving communities across the state. These professionals work primarily in hospitals and specialty clinics, with surgical subspecialties, emergency medicine, and family practice as the most common areas of focus. The workforce skews younger and predominately female, with most PAs having completed their education within Indiana.
Telehealth has emerged as an important service delivery method, with nearly half of PAs now offering remote care options. While PAs serve diverse patient populations, geographic distribution remains uneven. Urban counties benefit from robust PA presence, while many rural areas face significant gaps in coverage. More than 20 counties report no practicing PAs at all.
See the full PA workforce snapshot at the end of this post. Instructions for using it are below.
How to Use This Workforce Data Snapshot
This new workforce snapshot draws on the 2024 PA Data Report and provides an overview of PAs in Indiana based on data collected during the 2024 license renewal period.
Key Information Includes
- Total actively practicing professionals: the number of individuals licensed and practicing in Indiana
- Specialties: the areas of focus these professionals reported
- Primary practice setting: the environments in which these professionals work
- Services provided: the most common services these professionals offer to patients
- Populations served: the groups these professionals report working with most frequently
- Where professionals obtained their education: the geographic location where these professionals completed their qualifying degrees or training
These data can be used to understand the composition, distribution, and characteristics of Indiana’s PA workforce. They can inform workforce planning, policy decisions, and strategies to address service gaps across the state.
The workforce snapshot also includes a map illustrating the geographic distribution of all PAs across Indiana’s 92 counties, according to data collected during the 2024 license renewal cycle.
How to Read the Map
Counties are color-coded based on the ratio of the total population per one professional full-time equivalent (FTE). This measure indicates how many people each professional serves in a given county.
- Darker blue counties have fewer people per PA, indicating greater workforce availability.
- Lighter blue counties have more people per PA, indicating lower workforce availability.
- Gray counties have zero PAs.
View the full PA workforce snapshot below.
by Guest Author | May 8, 2025 | Data, News, Policy, Reports
The Bowen Center for Health Workforce Research and Policy at Indiana University is pleased to share its interim report to the Indiana Department of Health covering activities from July 2024 through January 2025.
This report provides an overview of the Center’s efforts to support data-driven health workforce planning and policy across Indiana and highlights ongoing initiatives which focus on health workforce data collection, analysis, and stakeholder collaboration. The report also reflects the Center’s continued commitment to producing actionable insights and engaging key partners to inform health workforce development and decision-making.
Through its work, the Bowen Center aims to ensure that Indiana’s health workforce is aligned with the needs of communities statewide. This interim report is intended to provide transparency on progress to date. We invite you to review the full report below to learn more.
by Guest Author | Apr 23, 2025 | Policy, Reports
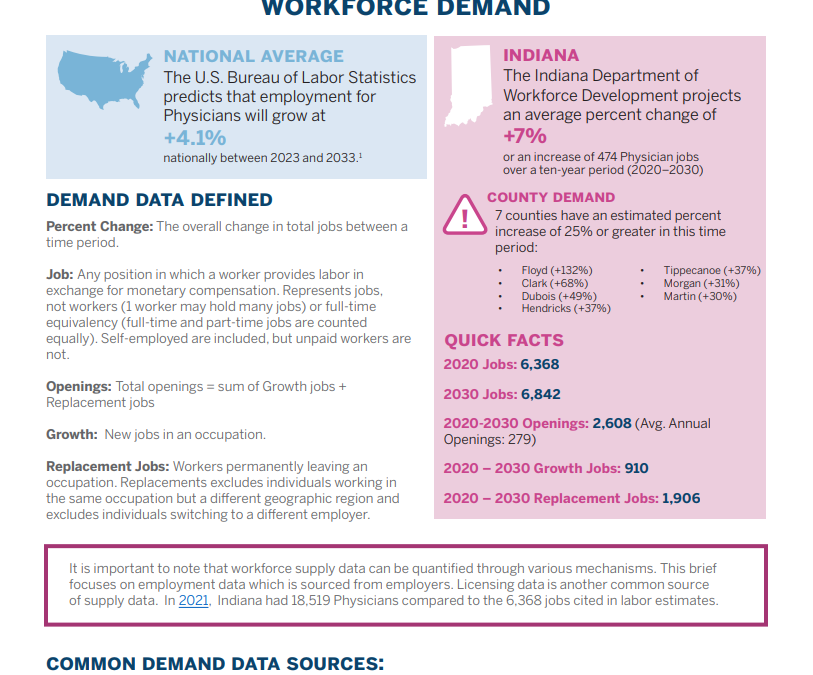
The 2023 Physicians Workforce Demand Brief describes the projected demand for physicians in Indiana using data from the Indiana Department of Workforce Development (DWD). According to the US Bureau of Labor Statistics, physician employment is projected to grow by 4.1% nationally between 2023 and 2033. In Indiana, the Department of Workforce Development forecasts a 7% increase, translating to 474 new physician jobs from 2020-2030.
The Demand brief also defines various terms related to demand projects and maps expected growth across Indiana’s counties. It serves as a valuable resource for understanding the evolving landscape of physician workforce needs in Indiana.
Check out the full brief below for more information and insights into the projected demand for physicians across the state.
by Guest Author | Apr 23, 2025 | Policy, Reports
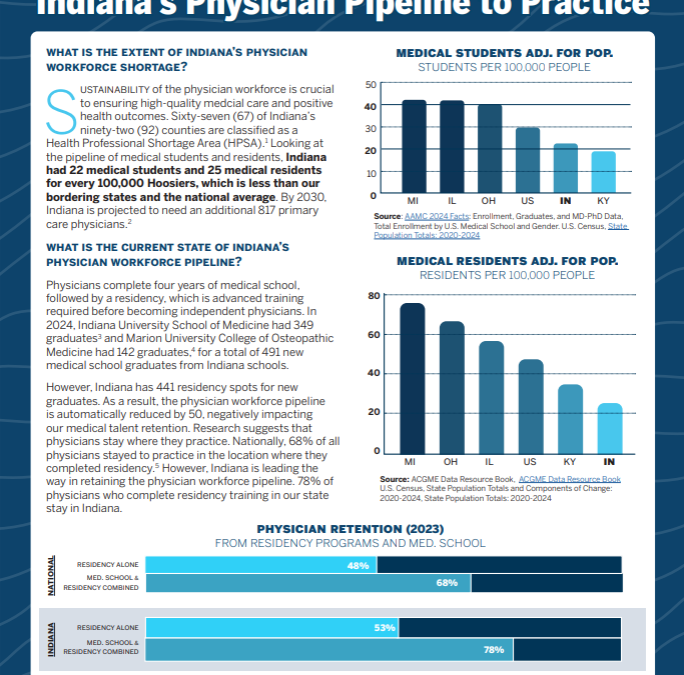
We released a brief report describing how Indiana’s physician pipeline-to-practice compares to our neighboring states and now comes the Bowen Snapshot: Indiana’s Physician Pipeline-to-Practice. This Snapshot summarizes the information included in the brief in just two pages! We hope this document succinctly communicates the state of Indiana’s physician pipeline and opportunities for strengthening it.
In addition to summarizing the extent of Indiana’s physician workforce shortage by looking at medical student and medical resident capacity, the Snapshot uses national data to quantify the size of the physician pipeline in 2024. It also describes the variation in state incentives to support the retention of doctors.
For more detailed insights, refer to the full snapshot below.