by Cleveland Dietz | Feb 26, 2026 | Data, Reports
The Bowen Center for Health Workforce Research and Policy has released its analysis of Indiana’s physician assistant workforce, offering insights into who these professionals are and where they practice.
The report paints a picture of a young, predominately female workforce, with most PAs holding advanced degrees and planning to continue in their current roles. These professionals work across diverse healthcare settings, from emergency departments to specialty clinics, and play a vital role in patient care throughout the state.
However, the data also reveal a challenge: geographic maldistribution. While urban communities tend to benefit from strong PA presence, some rural areas struggle with limited access or no PAs at all. This unevenness could affect healthcare access for Indiana residents.
The findings provide valuable context for understanding the strengths and gaps in the Indiana PA workforce. Read the full report below.

by Guest Author | Feb 26, 2026 | Data, Reports
Indiana’s physician assistant (PA) workforce reflects a young, growing profession with more than 2,400 actively practicing PAs serving communities across the state. These professionals work primarily in hospitals and specialty clinics, with surgical subspecialties, emergency medicine, and family practice as the most common areas of focus. The workforce skews younger and predominately female, with most PAs having completed their education within Indiana.
Telehealth has emerged as an important service delivery method, with nearly half of PAs now offering remote care options. While PAs serve diverse patient populations, geographic distribution remains uneven. Urban counties benefit from robust PA presence, while many rural areas face significant gaps in coverage. More than 20 counties report no practicing PAs at all.
See the full PA workforce snapshot at the end of this post. Instructions for using it are below.
How to Use This Workforce Data Snapshot
This new workforce snapshot draws on the 2024 PA Data Report and provides an overview of PAs in Indiana based on data collected during the 2024 license renewal period.
Key Information Includes
- Total actively practicing professionals: the number of individuals licensed and practicing in Indiana
- Specialties: the areas of focus these professionals reported
- Primary practice setting: the environments in which these professionals work
- Services provided: the most common services these professionals offer to patients
- Populations served: the groups these professionals report working with most frequently
- Where professionals obtained their education: the geographic location where these professionals completed their qualifying degrees or training
These data can be used to understand the composition, distribution, and characteristics of Indiana’s PA workforce. They can inform workforce planning, policy decisions, and strategies to address service gaps across the state.
The workforce snapshot also includes a map illustrating the geographic distribution of all PAs across Indiana’s 92 counties, according to data collected during the 2024 license renewal cycle.
How to Read the Map
Counties are color-coded based on the ratio of the total population per one professional full-time equivalent (FTE). This measure indicates how many people each professional serves in a given county.
- Darker blue counties have fewer people per PA, indicating greater workforce availability.
- Lighter blue counties have more people per PA, indicating lower workforce availability.
- Gray counties have zero PAs.
View the full PA workforce snapshot below.
by Hannah Maxey | Feb 25, 2026 | Other
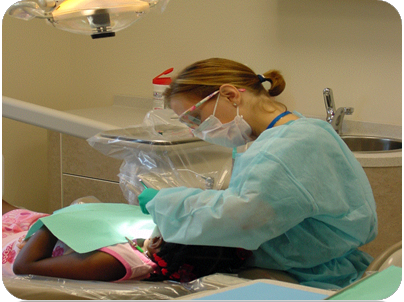
Featured Image: Bowen Center for Health Workforce Research and Policy Director Dr. Hannah Maxey providing dental care to a child in 2002.
February is a big month for teeth, all kinds of teeth! As we celebrate both National Children’s Dental Health Month and National Pet Dental Health Month, I find myself reflecting on my journey from dental hygienist to health workforce researcher, and why oral health still holds a special place in my heart (and my professional focus).
For nearly a decade, I practiced dental hygiene in public health clinics in Marion County, Indiana. I scaled tartar, taught proper brushing techniques to wiggly kindergarteners, and yes, occasionally dodged flying spit. It was hands-on, meaningful work that shaped how I think about healthcare access today. Those clinical years taught me something fundamental: Oral health isn’t separate from overall health. It’s the gateway.
Fast forward to today. I lead the Bowen Center for Health Workforce Research and Policy. I’ve traded my scalers for spreadsheets, but the mission hasn’t changed. Whether we’re talking about children who need preventive care or pets whose owners finally notice that doggy breath isn’t normal, access depends on having the right professionals in the right places.
Here’s what keeps me engaged: The workforce challenges are strikingly similar across the board. Pediatric dentists? There aren’t enough, especially in rural areas. Veterinary dentists? Even rarer. Dental hygienists who can practice in schools or community settings? Still fighting scope-of-practice in many states. The problems I witnessed as a practicing hygienist are the same ones I’m researching now, just with better data and hopefully more impact on policy.
Children’s oral health is particularly close to my heart. Dental disease remains the most common chronic childhood condition, yet it’s almost entirely preventable. When kids can’t access care because there aren’t enough providers or dental professionals can’t practice to the full extent of their training, that’s a workforce problem with real health consequences.
And our pets? They deserve better, too. Veterinary dental disease affects an estimated 80% of dogs and 70% of cats by age three, yet many pet owners don’t realize dental care is essential preventive medicine. The veterinary workforce faces similar shortages and geographic maldistribution as human healthcare.
This February, as I celebrate both these dental health months, I’m reminded why I loved clinical practice and why I’m passionate about workforce policy. The work I do now (tracking provider shortages, analyzing scope-of-practice regulations, informing policy decisions) all connects back to those days in the clinic, to the patients (both two-legged and four-legged) who need care, and to the dedicated professionals trying to provide it.
Some roots run deep. Mine just happen to start with health teeth and extend to caring about them in humans and animals alike.

Saint, our golden retriever puppy, smiling with healthy teeth in 2026.

by Mykayla Moore | Feb 18, 2026 | Policy
The Bowen Center for Health Workforce Research and Policy’s mission is to “inform health workforce policy that advances health.” This week’s blog looks at the workforce data behind recent legislative committee discussions on home health aide training and infrastructure improvements.
Home Health Aide Training Requirements
Home health aides are healthcare paraprofessionals who provide basic health support tasks, such as measuring vitals and simple dressing changes, to older adults and individuals with disabilities through licensed home health agencies. In 2022, the Bowen Center conducted a comprehensive review of state statute for home health aides and other direct care workers to support the Family and Social Services Administration’s Direct Service Workforce Plan. This review identified job functions, populations served, and training requirements for home health aides. Last week, legislation regarding those training requirements moved forward. Senate Bill (SB) 180 passed through the House Public Health Committee on February 10. This legislation would modify the requirement for home health aide training programs to include at least 75 hours of training and 16 hours of classroom training before providing supervised practical experience. If enacted, training would still be required in select topics, such as infection control and maintaining a clean, safe, and healthy environment.
For more data on Indiana’s home health aide workforce and other direct care workers, check out the interactive dashboard. New data are anticipated this fall.
Veterans Affairs Medical Center Infrastructure
Having enough training opportunities for healthcare students is essential for building Indiana’s health workforce, as most healthcare students are required to complete supervised clinical internships or practical experiences. The Richard L. Roudebush Veterans Affairs Medical Center (Indianapolis VAMC) has supported health professional training for over 50 years and partners with many of the universities and colleges across Indiana.
In 2022, the Bowen Center collaborated with Indianapolis VAMC to evaluate its impact on health workforce training in Indiana. Key findings include:
- Indianapolis VAMC commits approximately $90 million annually to supporting Indiana‘s future health professions
- More than 1,800 professionals across Indiana completed some of their training at Indianapolis VAMC.
Indianapolis VAMC plays a critical role in developing and strengthening Indiana’s health workforce. However, space and infrastructure have limited their ability to expand these efforts. SB 225 includes a provision that seeks to alleviate these infrastructure concerns. By modifying the duties of an existing subsidiary of the state department of health to include “enhance[ment] of health care resources and infrastructure for veterans,” an opportunity opens for the state of Indiana to receive federal funding to enhance the Indianapolis VAMC building. This bill also passed out of the Public Health Committee on February 10. We’ll keep tracking this bill and others as they move through the legislative process.
by Guest Author | Feb 11, 2026 | Data
The Bowen Center for Health Workforce Research and Policy has released its latest workforce snapshots covering Indiana’s behavioral health and human services (BHHS) workforce. The workforce is made up of 10,460 actively practicing professions as of 2024 license renewal data. Of those, 9,677 licensed professionals (excluding associates) and 783 are associate-level practitioners.
Snapshots by Profession and Number of Professionals
How to Use These BHHS Workforce Data Snapshots
These new snapshots provide an overview of BHHS professions in Indiana based on data collected during the 2024 license renewal period. Each BHHS profession has its own snapshot. Additionally, there are snapshots for BHHS professionals excluding associate-level licenses and BHHS associates only. All snapshots include the same highlighted information but specific to the group covered.
Key Information Includes
- Total actively practicing professionals: the number of individuals licensed and practicing in Indiana
- Specialties: the areas of focus these professionals reported
- Primary practice setting: the environments in which these professionals work
- Services provided: the most common services these professionals offer
- Populations served: the groups these professionals report working with most frequently
- Where professionals obtained their education: the geographic location where these professionals completed their qualifying degrees or training
These data can be used to understand the composition, distribution, and characteristics of Indiana’s BHHS workforce. They can inform workforce planning, policy decisions, and strategies to address service gaps across the state.
Check out the full snapshot for all BHHS professionals, excluding associates, below.
How to Read the Geographic Distribution Map
In addition to the workforce snapshots, the Bowen Center produced a map illustrating the geographic distribution of all BHHS professionals across all of Indiana’s 92 counties, according to data collected during the 2024 license renewal cycle.
Counties are color-coded based on the ratio of population to full-time equivalent (FTE) professionals. This measure indicates how many people each professional serves in a given county.
- Darker green counties have fewer people per BHHS professional, indicating greater workforce availability.
- Lighter green counties have more people per BHHS professional, indicating lower workforce availability.
- Gray counties have zero BHHS professionals.
The geographic distribution map of all BHHS professionals in Indiana can be found here.
This visualization helps identify geographic areas with potential workforce gaps and can be used to inform targeted recruitment, retention, and policy strategies to improve access to services across the state.